|
<< Click to Display Table of Contents >> Tutorial on Graphical Music Editing |
  
|
|
<< Click to Display Table of Contents >> Tutorial on Graphical Music Editing |
|
Composer offers graphical drawing tools for editing these six types of music data: tempo changes, volume level, left-to-right pan, note pitch bend, sustain pedal, and MIDI controller data.
Composer's graphical editing tools operate consistently, regardless of the type of music data. A few exceptions are noted in topics for the specific types of graphical music data.
The following tutorial shows you how to use Composer's graphical editing tools. The tutorial makes a variety of changes to the volume level graph for a staff. The results of this tutorial are admittedly not very interesting from a musical point of view. The purpose of this tutorial is to demonstrate how to use the graphical editing tools rather than why to use them. There are separate topics for each of the six types of graphical music data that explain the use of the graphical editing tools in the context of why you might use them to accomplish certain musical results.
In this tutorial, it is not necessary that you draw the graphs exactly as shown. If you do not find it convenient to follow the tutorial steps while running Composer, you will still probably find it useful to read this tutorial.
![]() Procedure 1 -- To start the tutorial:
Procedure 1 -- To start the tutorial:
| 1. | Using the Open MIDI or Note File command in the File menu, open the file GraphicalEditingTutorial.not in Composer's Song directory: C:\Users\Public\Documents\Notation_3\Songs. |
| 2. | Save a copy of the file with a new name, such as GraphicalEditingTutorial2.not, and continue working with the copy instead of the original file, in case you or another person sharing your computer wants to work through the tutorial. For this purpose, use the Save Song File As command in the File menu. |
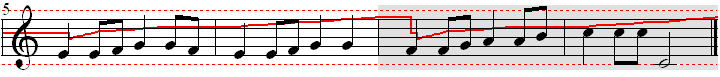
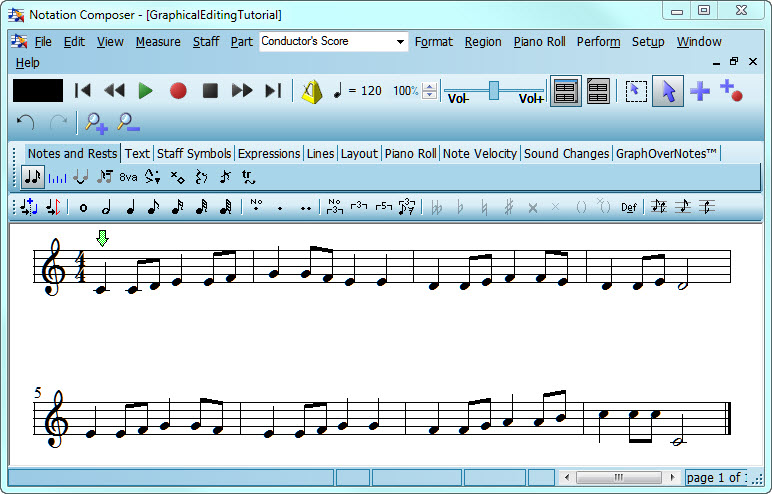
The song is very simple. It has only one staff and eight measures:
A single GraphOverNotestm Palette supports editing for each of the five types of graphical music information.
![]() Procedure 2 -- To display the GraphOverNotestm Palette and choose a type of music information to edit:
Procedure 2 -- To display the GraphOverNotestm Palette and choose a type of music information to edit:
| 1. | Click the GraphOverNotestm tab in the main palette. |
-- OR --
Type SHIFT+X.
| 2. | In the first of the two groups of buttons in the GraphOverNotestm Palette, click one of the six buttons for the type of music information you wish to edit. |
In this tutorial, click the Volume ![]() button if it is not already selected.
button if it is not already selected.
-- OR --
Type "v" for staff volume.
Composer draws a graph of the selected music information type (staff volume level):
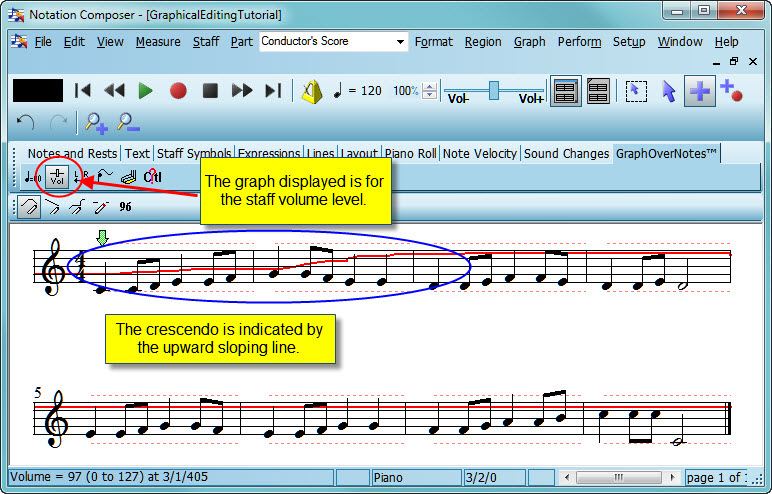
The thick red line is the graph of the staff volume level throughout the song. At the beginning of the song, the line slopes upward, indicating an increase in volume level, that is, a crescendo. If you play the song now, you will hear the volume level increase over the first two measures.
The dotted red lines mark the minimum and maximum values. In the case of volume level, the minimum and maximum values are 0 and 127, which is the range of volume levels defined by MIDI.
At first, it may concern you that the graph is drawn without any indication of the scale and range of values. It may also concern you that the short distance on the screen between the minimum and maximum value might not offer you sufficient precision for editing the graph. The next two procedures show you how you can gain visibility and precision in editing the graph.
![]() Procedure 3 -- To determine the value of the graph at any location in the song:
Procedure 3 -- To determine the value of the graph at any location in the song:
| To view the current value at a particular location, move the mouse cursor there. |
In the status bar, Composer displays the location of the mouse as a measure/beat/tick, and displays the exact value of the graph at that location. In the above example, the volume level is 95 at measure 6, beat 1, tick 225.
When you are viewing rather than editing the graph, it does not matter what the vertical position of the mouse is.
| While editing the graph according to one of the procedures below, the vertical position of the mouse on the score determines what the newly applied value will be. The report in the status bar tells you the exact value corresponding to the vertical position of the mouse. |
![]() Procedure 4 -- To increase the precision of the graph:
Procedure 4 -- To increase the precision of the graph:
| Use the Zoom In command in the View menu. |
-- OR --
Click the Zoom In ![]() button one or more times.
button one or more times.
-- OR --
Type Z+![]() one or more times.
one or more times.
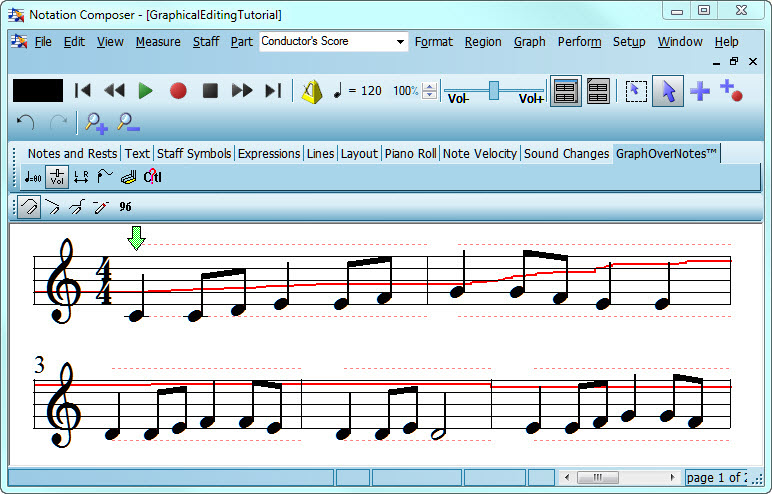
The score and graph are now magnified on the screen so that you can more precisely edit the graph, as shown here:
If you are viewing or editing the tempo graph, you can also temporarily specify a narrow range for the minimum and maximum values of the graph, such as 80 to 120 quarter notes per minute. For details, see Editing the Tempo Graphically.
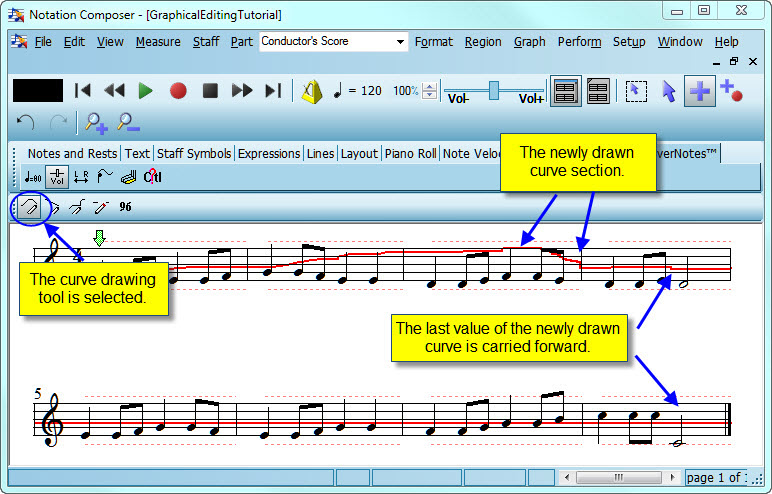
![]() Procedure 5 -- To draw a curve on the graph:
Procedure 5 -- To draw a curve on the graph:
| 1. | Choose the Draw Curve command in the Graph Menu. |
-- OR --
Type "d" for draw.
-- OR --
Click the Draw Curve ![]() button in the GraphOverNotestm Palette.
button in the GraphOverNotestm Palette.
| 2. | Move the mouse to where you want to start drawing the curve. |
| 3. | Press down the left mouse button. |
| 4. | While holding down the left mouse button, drag the mouse around on the graph. You can move the mouse back and forth horizontally to change a portion of the curve, or to extend the beginning or end of the range of locations that you are editing. |
| 5. | While still holding down the mouse button, you can move it to a different staff for the same instrument. Composer will continuously update the graph as you move the mouse. Changes you make to the volume level will propagate to the next location where there is another change of volume level. Thus, sometimes you will observe the graph to the right of the mouse shifting up or down as you move the mouse up and down. Futher, you may see the graph for other staves of the same instrument shift up or down as you move the mouse. |
For example, draw a curve similar to the one shown below. Notice how the graph drawn to the right of the mouse moves up and down as you move the mouse up and down and to the right. Notice also how the graph in the second staff also moves up and down:
| 6. | If, while still holding down the mouse button, you need to move the mouse across staves of other instruments to reach another staff for the one you started with, Composer will wait until you move the mouse into another staff for the same instrument. |
| 7. | If, while still holding down the mouse button, you need to continue drawing on another page, hit the PAGEDOWN or PAGEUP key. (This might require using your second hand to type the PAGEDOWN or PAGEUP key.) Composer will still continuously update the graph as you move the mouse on the other page. |
| 8. | Release the mouse button when you are done drawing the volume level curve. |
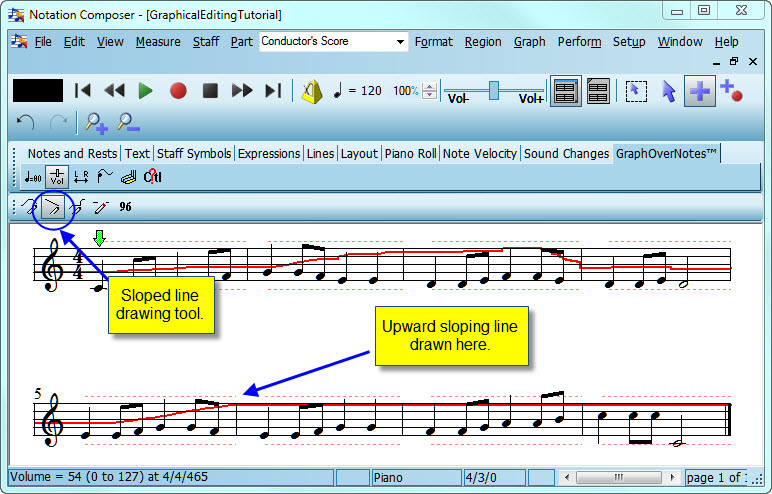
![]() Procedure 6 -- To draw a sloped line on the graph:
Procedure 6 -- To draw a sloped line on the graph:
This procedure describes how to draw a sloped line with the mouse. You can also use the numeric value tool to specify a starting and ending value for a selected region. By that alternative method, you enter the exact values in a dialog box. See Procedure 10 below.
| 1. | Choose the Draw Sloped Line command in the Graph Menu. |
-- OR --
Type "l" (lower-case) for line.
-- OR --
Click the Draw Sloped Line ![]() button in the GraphOverNotestm Palette.
button in the GraphOverNotestm Palette.
| 2. | Follow the same instructions as above for drawing a continuous curve. The only difference is that the Draw Sloped Line tool draws a straight line rather than a continuously curved line. |
For example, draw an upward sloping line in the fifth measure. Since you are editing the staff volume level, the musical result is a crescendo in the fifth measure:
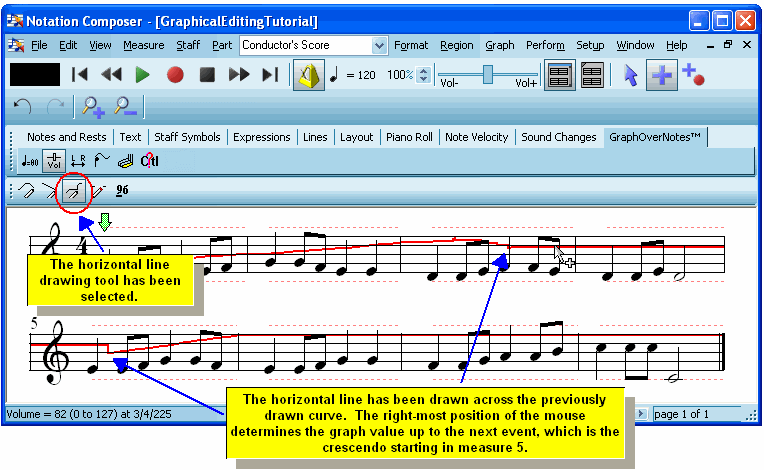
![]() Procedure 7 -- To draw a horizontal segment in the graph:
Procedure 7 -- To draw a horizontal segment in the graph:
| 1. | Choose the Draw Horizontal Line command in the Graph Menu. |
-- OR --
Type "h" for horizontal line.
-- OR --
Click the Draw Horizontal Line ![]() button in the GraphOverNotestm Palette.
button in the GraphOverNotestm Palette.
| 2. | Move the mouse to where you want to start the horizontal line. The vertical position where you where click the mouse determines the height of the horizontal line on the graph. |
| 3. | Press down the left mouse button. |
| 4. | While holding down the left mouse button, drag the mouse around on the graph. You can move the mouse back and forth horizontally to extend the line to the left or right. The horizontal line moves up or down as you move the mouse. |
| 5. | Release the mouse button when you are done drawing the horizontal line. |
For example, draw a horizontal line across the portion of the graph for which you had previously drawn a curve:
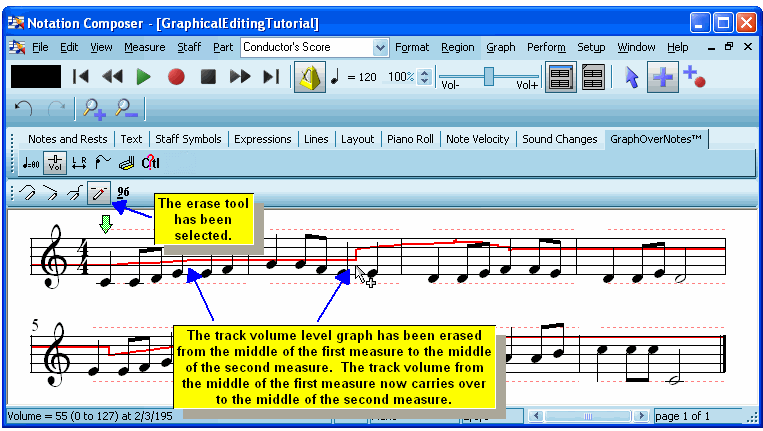
There are two ways to erase a portion of a graph: (1) by dragging the mouse over an area of the graph with the erase tool, and (2) by selecting a region and hitting the ![]() key. Both methods are described below.
key. Both methods are described below.
![]() Procedure 8 -- To erase a portion of the graph using the erase tool:
Procedure 8 -- To erase a portion of the graph using the erase tool:
| 1. | Choose the Erase command in the Graph Menu. |
-- OR --
Type "e" for erase.
-- OR --
Click the Erase ![]() button in the GraphOverNotestm Palette.
button in the GraphOverNotestm Palette.
| 2. | While holding down the left mouse button, drag the mouse over the portion of the graph you wish to erase. |
<%PROD%> will draw a horizontal line across the portion that you have erase. The staff volume level value for the region that you erase will be that value immediately preceding the erased region.
For example, if,you erase the staff volume level in the second measure, the staff volume level graph will look like this:
![]() Procedure 9 -- To erase a selected region of a graph:
Procedure 9 -- To erase a selected region of a graph:
| 1. | Select a region of the staff by holding down the CTRL key and dragging the mouse across the region. |
| 2. | Hit the |
To try out this method of erasing, use the Undo command in the Edit menu to reverse the erasing you did in the previous step. Select the second measure by dragging the mouse over it while holding down the CTRL key. Then hit the DEL key. The result will be the same as shown above.
![]() Procedure 10 -- To specify an exact numeric value for some region of a staff:
Procedure 10 -- To specify an exact numeric value for some region of a staff:
| 1. | Select a region of the staff by holding down the CTRL key and dragging the mouse across the region. |
For example, select the last two measures 7 and 8 of the song.
| 2. | Choose the Enter Numeric Value command in the Graph Menu. |
-- OR --
Type "n" for numeric value.
-- OR --
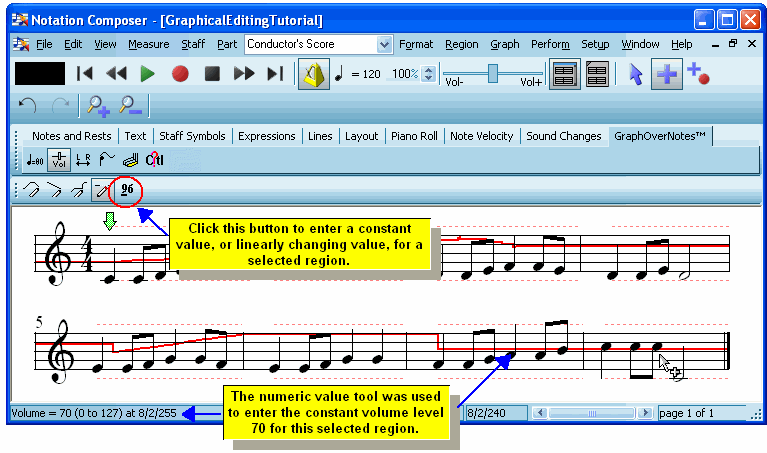
Click the Constant Numeric Value ![]() button in the GraphOverNotestm Palette.
button in the GraphOverNotestm Palette.
Composer will display a dialog box such as the following:
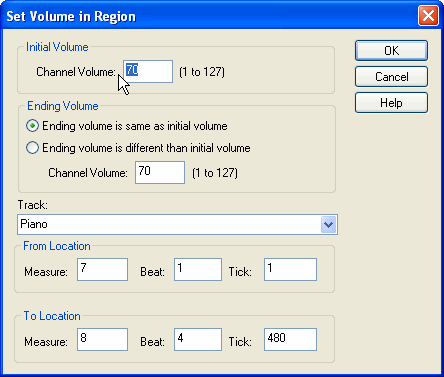
The above dialog box will indicate the staff and region (From Location and To Location) that you selected. You can optionally change the selection in the dialog box. The dialog box also shows the current volume level value at the beginning of the selected region. It is 70 in this example.
| 3. | Enter a new volume level (such as 70 here) that will be applied to the selected region. Volume level values ranges from 0 to 127, as defined by MIDI. |
The result is shown here:
To achieve certain musical intentions, you can stretch a graph to make it wider or narrower, horizontally or vertically; shift a graph to the right or left; and uniformly raise or lower the graph. For example, you can horizontally stretch the graph for a crescendo so that it extends over a greater number of beats in the song. You can vertically stretch a graph for a note pitch bend to make the pitch go higher or lower over the same duration. The procedures for stretching and shift graphs all include a step in which you select the region to be stretched or shifted.
![]() Procedure 11 -- To stretch a selection portion of the graph horizontally, thus extending the curve over a longer or shorter range of beats in a staff:
Procedure 11 -- To stretch a selection portion of the graph horizontally, thus extending the curve over a longer or shorter range of beats in a staff:
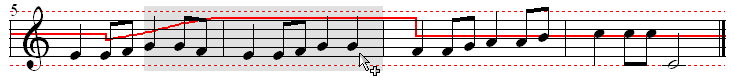
| 1. | Select a region in a staff by dragging the mouse while holding down the CTRL key. Start the mouse drag at the beginning of the region you wish to stretch. If you want to stretch the selected portion of the graph so that it spans more time, then end the mouse drag at the location where you would like the stretch to end when you are done. If you want to stretch the selected portion of the graph so that it spans less time, then end the mouse drag at the end of the portion of the graph that you want to shrink. |
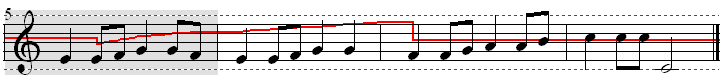
For example, prepare to stretch the crescendo in the middle of the fifth measure so that it will extend to the end of the sixth measure:
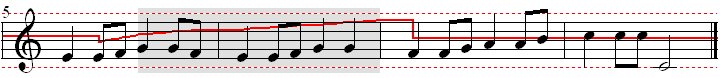
| 2. | To stretch the graph to the right or left, hold down both the CTRL key and |
For example, hold down the CTRL and ![]() keys until the crescendo in the fifth measure extends to the end of the selected region in the end of the sixth measure:
keys until the crescendo in the fifth measure extends to the end of the selected region in the end of the sixth measure:
![]() Procedure 12 -- To stretch a selected portion of the graph vertically:
Procedure 12 -- To stretch a selected portion of the graph vertically:
| | Follow the previous procedure, except while holding down the CTRL key, use the |
A particularly useful application of this procedure is for pitch bend. (In fact, it is the only graphical data you can stretch vertically.) You can stretch a pitch bend so that it changes the pitch higher or lower, over the same duration of time,while preserving the overall contour of increasing and decreasing pitch. For details, see Editing the Pitch Bend of Notes.
![]() Procedure 13 -- To shift a selected portion of the graph to the right or left:
Procedure 13 -- To shift a selected portion of the graph to the right or left:
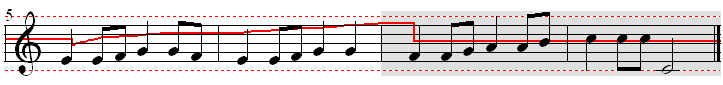
| 1. | As in the previous procedure, select a region of the graph that you wish to shift, including the area to the right or left into which you wish to shift the graph. |
The previous tutorial step resulted in a crescendo that extends from the middle of measure 5 to the end of measure 6. Prepare to shift the first part of the crescendo to the left, so that it will start at the beginning of measure 5:
| 2. | Hold down the |
For example, hold down the ![]() key until the crescendo shifts backward a half measure:
key until the crescendo shifts backward a half measure:
![]() Procedure 14 -- To shift a selected portion of the graph up or down:
Procedure 14 -- To shift a selected portion of the graph up or down:
| 1. | Follow the same steps as in the previous procedure, except select the exact region for which you wish to raise or lower the graph. |
| 2. | Hold down the |
You can also copy portions of a graph from one region to another. For example, you can copy a pitch bend from one note to another in the same staff, or to another staff. You can copy the graphs for multiple staves at a time. For example, you can copy the volume level graph for all staves from one section of the song to another. You can even copy graphs from one song to another.
![]() Procedure 15 -- To copy a graph from one region to another:
Procedure 15 -- To copy a graph from one region to another:
| 1. | Select the region you wish to copy. |
For example, select measures 5 and 6, as shown below:
| 2. | In the Graph Menu, choose the Copy Graph from Region command. |
-- OR --
Type CTRL+C, which is the standard Windows keyboard command for Copy to Clipboard.
| 3. | Select the region you wish to copy the graph into. |
For example, select measures 7 and 8, as shown below:
| 4. | Choose the Paste Saved Graph Into Region command in the Graph Menu. |
-- OR --
Type CTRL+V, which is the standard Windows keyboard command for "paste from the clipboard".
The result is shown below. Notice how the shape of the graph in measures 7 and 8 is exactly the shape of the graph that it was copied from in measures 5 and 6: