Tutorial on Graphical Music Editing


|
Tutorial on Graphical Music Editing |
|
|
Composer offers graphical drawing tools for editing these six types of music data: tempo changes, volume level, left-to-right pan, note pitch bend, sustain pedal, and MIDI controller data. Composer's graphical editing tools operate consistently, regardless of the type of music data. A few exceptions are noted in topics for the specific types of graphical music data. The following tutorial shows you how to use Composer's graphical editing tools. The tutorial makes a variety of changes to the volume level graph for a staff. The results of this tutorial are admittedly not very interesting from a musical point of view. The purpose of this tutorial is to demonstrate how to use the graphical editing tools rather than why to use them. There are separate topics for each of the six types of graphical music data that explain the use of the graphical editing tools in the context of why you might use them to accomplish certain musical results. In this tutorial, it is not necessary that you draw the graphs exactly as shown. If you do not find it convenient to follow the tutorial steps while running Composer, you will still probably find it useful to read this tutorial.
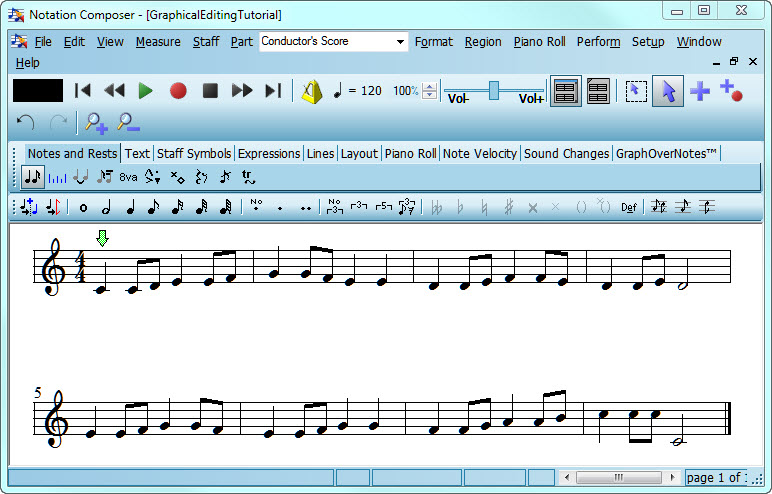
The song is very simple. It has only one staff and eight measures:
A single GraphOverNotestm Palette supports editing for each of the five types of graphical music information.
-- OR -- Type SHIFT+X.
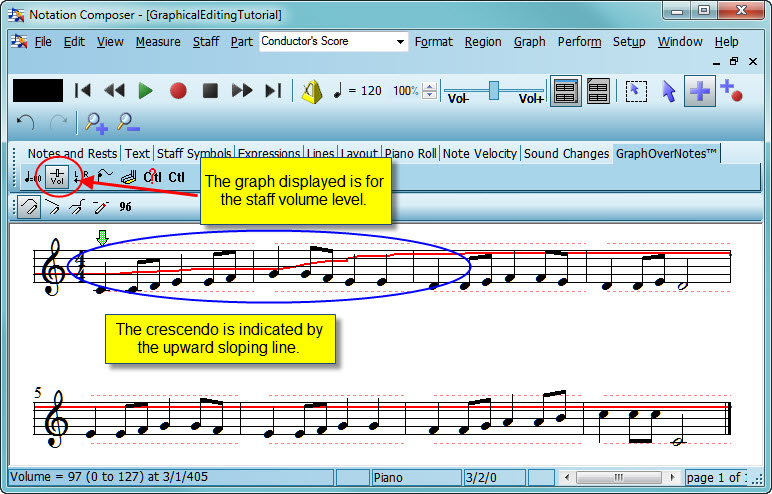
In this tutorial, click the Volume -- OR -- Type "v" for staff volume. Composer draws a graph of the selected music information type (staff volume level):
The thick red line is the graph of the staff volume level throughout the song. At the beginning of the song, the line slopes upward, indicating an increase in volume level, that is, a crescendo. If you play the song now, you will hear the volume level increase over the first two measures. The dotted red lines mark the minimum and maximum values. In the case of volume level, the minimum and maximum values are 0 and 127, which is the range of volume levels defined by MIDI. At first, it may concern you that the graph is drawn without any indication of the scale and range of values. It may also concern you that the short distance on the screen between the minimum and maximum value might not offer you sufficient precision for editing the graph. The next two procedures show you how you can gain visibility and precision in editing the graph.
In the status bar, Composer displays the location of the mouse as a measure/beat/tick, and displays the exact value of the graph at that location. In the above example, the volume level is 95 at measure 6, beat 1, tick 225. When you are viewing rather than editing the graph, it does not matter what the vertical position of the mouse is.
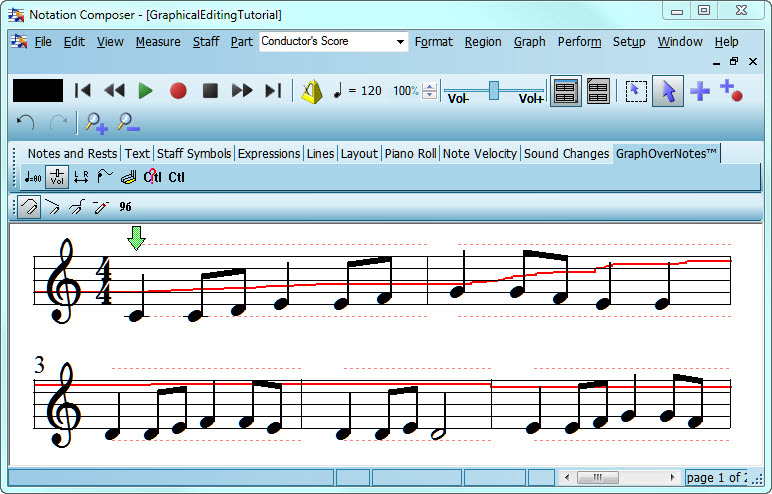
-- OR -- Click the Zoom In -- OR -- Type Z+ The score and graph are now magnified on the screen so that you can more precisely edit the graph, as shown here: If you are viewing or editing the tempo graph, you can also temporarily specify a narrow range for the minimum and maximum values of the graph, such as 80 to 120 quarter notes per minute. For details, see Editing the Tempo Graphically.
-- OR -- Type "d" for draw. -- OR -- Click the Draw Curve
For example, draw a curve similar to the one shown below. Notice how the graph drawn to the right of the mouse moves up and down as you move the mouse up and down and to the right. Notice also how the graph in the second staff also moves up and down:
This procedure describes how to draw a sloped line with the mouse. You can also use the numeric value tool to specify a starting and ending value for a selected region. By that alternative method, you enter the exact values in a dialog box. See Procedure 10 below.
-- OR -- Type "l" (lower-case) for line. -- OR -- Click the Draw Sloped Line
For example, draw an upward sloping line in the fifth measure. Since you are editing the staff volume level, the musical result is a crescendo in the fifth measure:
-- OR -- Type "h" for horizontal line. -- OR -- Click the Draw Horizontal Line
For example, draw a horizontal line across the portion of the graph for which you had previously drawn a curve: There are two ways to erase a portion of a graph: (1) by dragging the mouse over an area of the graph with the erase tool, and (2) by selecting a region and hitting the
-- OR -- Type "e" for erase. -- OR -- Click the Erase
<%PROD%> will draw a horizontal line across the portion that you have erase. The staff volume level value for the region that you erase will be that value immediately preceding the erased region. For example, if,you erase the staff volume level in the second measure, the staff volume level graph will look like this:
To try out this method of erasing, use the Undo command in the Edit menu to reverse the erasing you did in the previous step. Select the second measure by dragging the mouse over it while holding down the CTRL key. Then hit the DEL key. The result will be the same as shown above.
For example, select the last two measures 7 and 8 of the song.
-- OR -- Type "n" for numeric value. -- OR -- Click the Constant Numeric Value Composer will display a dialog box such as the following: The above dialog box will indicate the staff and region (From Location and To Location) that you selected. You can optionally change the selection in the dialog box. The dialog box also shows the current volume level value at the beginning of the selected region. It is 70 in this example.
The result is shown here: To achieve certain musical intentions, you can stretch a graph to make it wider or narrower, horizontally or vertically; shift a graph to the right or left; and uniformly raise or lower the graph. For example, you can horizontally stretch the graph for a crescendo so that it extends over a greater number of beats in the song. You can vertically stretch a graph for a note pitch bend to make the pitch go higher or lower over the same duration. The procedures for stretching and shift graphs all include a step in which you select the region to be stretched or shifted.
For example, prepare to stretch the crescendo in the middle of the fifth measure so that it will extend to the end of the sixth measure:
For example, hold down the CTRL and
A particularly useful application of this procedure is for pitch bend. (In fact, it is the only graphical data you can stretch vertically.) You can stretch a pitch bend so that it changes the pitch higher or lower, over the same duration of time,while preserving the overall contour of increasing and decreasing pitch. For details, see Editing the Pitch Bend of Notes.
The previous tutorial step resulted in a crescendo that extends from the middle of measure 5 to the end of measure 6. Prepare to shift the first part of the crescendo to the left, so that it will start at the beginning of measure 5:
For example, hold down the
You can also copy portions of a graph from one region to another. For example, you can copy a pitch bend from one note to another in the same staff, or to another staff. You can copy the graphs for multiple staves at a time. For example, you can copy the volume level graph for all staves from one section of the song to another. You can even copy graphs from one song to another.
For example, select measures 5 and 6, as shown below:
-- OR -- Type CTRL+C, which is the standard Windows keyboard command for Copy to Clipboard.
For example, select measures 7 and 8, as shown below:
-- OR -- Type CTRL+V, which is the standard Windows keyboard command for "paste from the clipboard". The result is shown below. Notice how the shape of the graph in measures 7 and 8 is exactly the shape of the graph that it was copied from in measures 5 and 6: |


|